August 2022 Real Estate Snapshot

The data confirms that the Denver Metro area is no longer in a shifting market. Instead, it has shifted, and the real estate market is more balanced. Month-over-month, the market is down 3.33 percent but compared to last year, it is still up 11.04 percent, indicating that a more balanced market, combined with slightly decreasing interest rates, may create opportunity for those who previously felt burned out on the process.
One of the primary indicators of a shifted market is the close-price-to-list-price ratio, which was down to 100.81 percent. Buyers have become more specific about what they are looking for and frequently question if, and how much, below the asking price they can offer. Gone are the days that a seller can simply put a sign in the yard and expect their home to sell.
Every indicator points to the market shifting closer to a buyer’s market. The month-end active listings increased 21.53 percent last month. Pending and closed deals decreased and days in the MLS increased by exactly 30 percent. However, the market is still far from what many experts would consider a buyer’s market. There are over 2,000 fewer properties on the market today than there were three years ago and, during the last three years, the amount of standing inventory peaked in June and July, which was abnormal. Historically, the market doesn’t peak until August or September.
**Data Source ReColorado
March 2022 Real Estate Snapshot

Quick Stats:
In January of 2010, we closed 809 distressed homes. That statistic represented 40.5 percent of all closings. Last January, that number dropped to only eight distressed homes or 0.25 percent of all closings. This January the numbers continued to drop to a total of five distressed homes or 0.17 percent of the total. Of the five, two were bank-owned, three were HUD foreclosures and non were short sales. At this point, COVID restrictions had no discernible effect on the market.
Average active listings for February are 13,220 (1985-2021)
Record-high February was 2006 with 25,484 listings and the record low was set this year with 1226 listings.
The historical average decrease in active listings from January to February is 2.88 percent. An increase of 3.55 percent this Februay represents a needed rise in housing inventory.
February 2022 Real Estate Snapshot
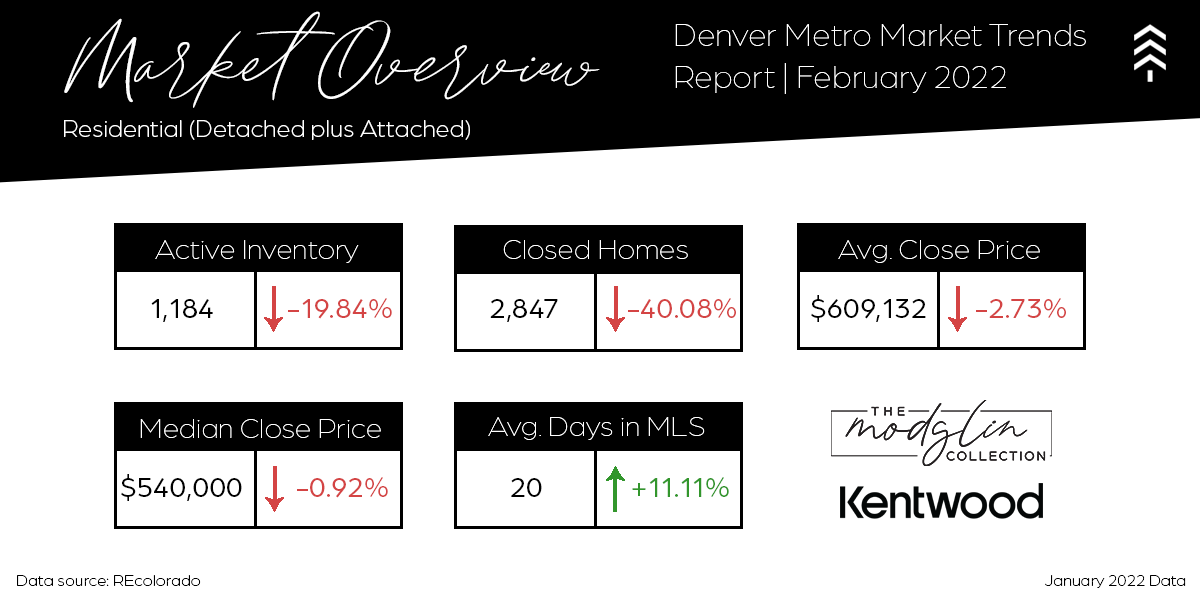

Quick Stats:
The average active listings for January is 12,732 (1985-2021)
Record-high January was 2008 24,550 listings, and the record-low was set this year with 1,184 listings
The historical average decrease in active listings from December to January is 5.30 percent. A decrease of 19.84 percent this January represents the second-largest percentage decrease on record. 2014 saw a decrease of 20.69 percent.
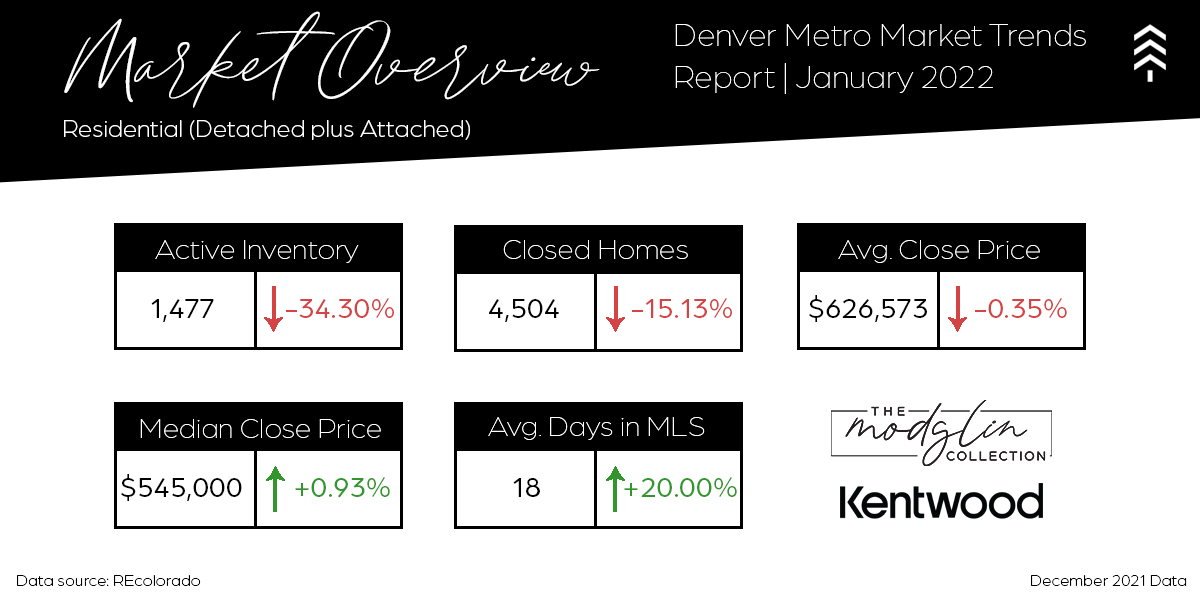
January 2022 Real Estate Snapshot

Photo by: @WalnutStreetPhotography
Quick Stats:
The average active listings in December is 12,652 (1985-2020).
Record-high December was 2007 with 24,603 and the recor- low was set December 2021 with 1477 listings.
The historical average decrease in active listings from November to December is 15.06.percent. This December, a decrease of 34.3 percent represents the largest percentage decrease on record.